
The digital gaming industry, as one of the primary sectors in the entertainment and creative industries, has garnered significant attention in recent years and is one of the fastest-growing sectors globally. This industry encompasses game development, marketing, distribution, feedback collection, and revenue generation from digital games, as well as the hardware required for this industry. It includes tens of job fields and thousands of jobs worldwide. The gaming industry has influenced the advancement of personal computer technology through sound cards, graphics cards, 3D graphics accelerators, processors, and auxiliary processors like PhysX. For example, sound cards were initially developed for games and then improved for use in the music industry.
Traditionally, the video game industry, based on retail distribution of games, consists of six primary layers in its value chain:
- Game Development: Comprising programmers, designers, artists, and their leadership, supported by middleware and other development tools responsible for designing, developing, and releasing digital games.
- Publishing: Typically includes funding for video game development as well as marketing and advertising for a game.
- Distribution: Whether through retail or digital channels. Distribution often involves the production and duplication of game media and packaging of retail games.
- Retail: The storefront where games are sold.
- Users or Consumers: Buyers and players of video games.
- Hardware Platform Manufacturers: They may also own the platform they have built and can impose restrictions on content and collect licensing fees from developers or publishers.
The primary entertainment for a metropolis of smart games is digital games. Recent statistics indicate a significant growth in the global gaming (game) industry. Additionally, a major portion of this industry’s audience includes teenagers and young adults who are also potential audiences for the gaming metropolis. Therefore, paying attention to this area can be of great importance.
According to data published in 2023, the total revenue of the gaming industry worldwide is estimated to be around 490 billion dollars and is expected to reach approximately 688 billion dollars by 2027, with an average annual growth rate (CAGR) of 8.84%. Notably, the total revenue in the non-hardware sectors of this industry (excluding game hardware and physical game sales) is estimated to be about 334 billion dollars in 2023 [1] and [2]. The figure below shows the revenue growth of this industry, broken down by different sectors.

Figure 1: Revenue flow of different sectors of the gaming industry from 2017 to 2027 [1].
It’s worth mentioning that the term ‘revenue’ here refers to the amount generated by the industry in line with consumer expenses on games, for example: physical and digital versions of games, in-game expenditures, subscription services like Xbox Game Pass, mobile revenues including paid downloads and in-game spending across all stores, including third-party stores, and direct receipts.
Furthermore, the figure below illustrates the gaming industry’s revenue divided by game types and technologies or gaming devices over the past 50 years from 1970 to 2020. This shows that mobile games have the largest share, followed by PC-based games and then consoles. Arcades and handheld gaming devices have lost their market share over the years, being replaced by VR-based games and cloud gaming, which are increasing their share in the market.
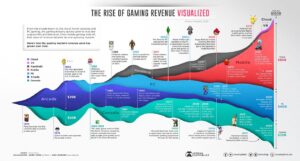
Figure 2 depicts the revenue share of each sector in the gaming industry from 1970 to 2020 [3].
Figure 3 presents the revenue stream of the gaming industry based on various gaming platforms in 2023. It is observed that this revenue shows a 2.6% growth compared to the previous year. Moreover, as shown in Figure 3, the highest revenue comes from mobile games, followed by console games, and then PC-based games, even though PCs have a higher user base compared to consoles.
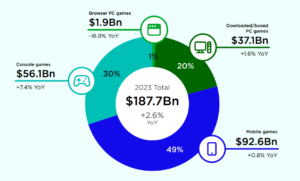
Figure 3: Revenue stream and share of each type of gaming platform in 2023 worldwide [4].
Looking at the industry from a user base perspective, the highest number of users belongs to the digital games sector, including console and PC, followed by mobile games. Notably, there is an expected growth in the number of game streaming users in the coming years. Ultimately, according to NEWZOO estimates, the number of users in this industry is expected to be around 3.38 billion in 2023 and reach 4.0 to 4.3 billion worldwide by 2027. This player base consists of approximately 900 million PC gamers, about 630 million console users, and around 2.85 billion smartphone gamers.
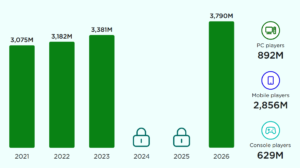
Figure 4: Comparison of the number of users in different sectors of the gaming industry from 2017 to 2027 [4].
Regarding the average revenue per user in the entire gaming industry, the highest per capita revenue belongs to the hardware sector, followed by mobile games. The per capita for other areas is relatively close and predicted to have a relatively stable trend in the coming years. The figure below shows the per capita revenue of different hardware and software sectors of this industry worldwide from 2017 to 2027.

Figure 5: Per capita revenue of different hardware and software sectors of the gaming industry per user [1].
Figure 6 depicts the geographical distribution of users and players in the gaming industry worldwide in 2023. Overall, the total number of gamers shows a 6.3% growth compared to the previous year. It is observed that more than half of the gamers are located in Asia and Oceania, which is not surprising given the presence of populous countries like China and India in this region. This is followed by countries in the Middle East and Africa, and then European countries.
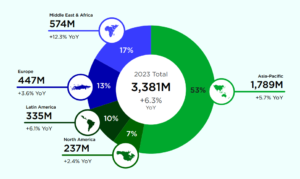
Figure 6: Geographical distribution of gamers in the gaming industry worldwide in 2023 [4].
Based on the geographical distribution of the gaming industry’s revenue stream, shown in Figure 7, a notable point is that although North America has a lower rank in terms of the number of gaming users compared to other populous regions of the world, it has the second-highest revenue share in this industry after the countries in Asia and Oceania.
The highest revenue increase is seen in the countries of the Middle East and North Africa, with approximately a 7% growth, followed by Latin American countries with a 4.3% increase. The least revenue growth compared to the previous year belongs to Asian and Oceanian countries.
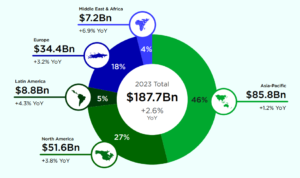
Figure 7: Geographical distribution of the revenue stream of video games worldwide in 2023 [4].
The figure below shows the top 10 gaming markets in the world, ranked in descending order based on their estimated revenue for 2022.

Figure 8: Top gaming markets in the world.
Figure 9 presents a list of 35 countries in different regions of the world that account for over 90% of the gaming industry’s revenue share. It is observed that, unfortunately, Iran does not have a place on this list, despite the fact that, considering its young population and other indicators such as access to gaming equipment and technical knowledge in game production, it could be in a better position than many countries on this list.
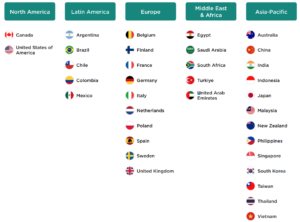
Figure 9: The list of 35 key countries in the gaming industry covering over 90% of the industry’s revenue stream [4].
The top countries in the world in the gaming sector are the United States and China, respectively, with revenues of 96.7 and 93.2 billion dollars from this field. They are followed by Japan with a revenue of 46 billion dollars, and then South Korea and the United Kingdom with revenues of 15 and 10 billion dollars, respectively. Iran’s revenue, based on estimates from the statistical website Statista, is estimated to be around 850 million dollars in 2023.
Additionally, examining the industry from the perspective of the major companies in the gaming world, the list of the top 10 companies based on revenues generated in the first quarter of 2023 is as follows. This table only attempts to consider revenues from the gaming sector, excluding other revenues of the companies from different fields, as we know companies like Sony or Apple have substantial revenues from other areas.
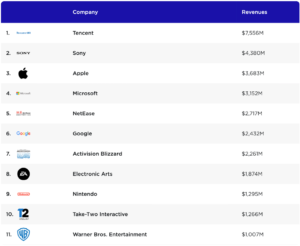
Figure 10: The top ten companies in the global gaming industry based on estimated revenues in the first quarter of 2023 [5].
References:
[1] | Statista, “Games – Worldwide,” Statista Market Insights, 2023, https://www.statista.com/outlook/amo/media/games/worldwide |
[2] | Statista, “Video Games – Worldwide,” Statista Market Insights, 2023, https://www.statista.com/outlook/dmo/digital-media/video-games/worldwide#revenue |
[3] | C. W. Omri Wallach, “50 Years of Gaming History, by Revenue Stream (1970-2020),” Visual Capitalist, 2020, https://www.visualcapitalist.com/50-years-gaming-history-revenue-stream/ |
[4] | T. Wijman, “Global Games Market Report,” Newzoo, 2023. |
[5] | “Top public games companies by revenues,” Newzoo International B.V., 2023, https://newzoo.com/resources/rankings/top-25-companies-game-revenues |